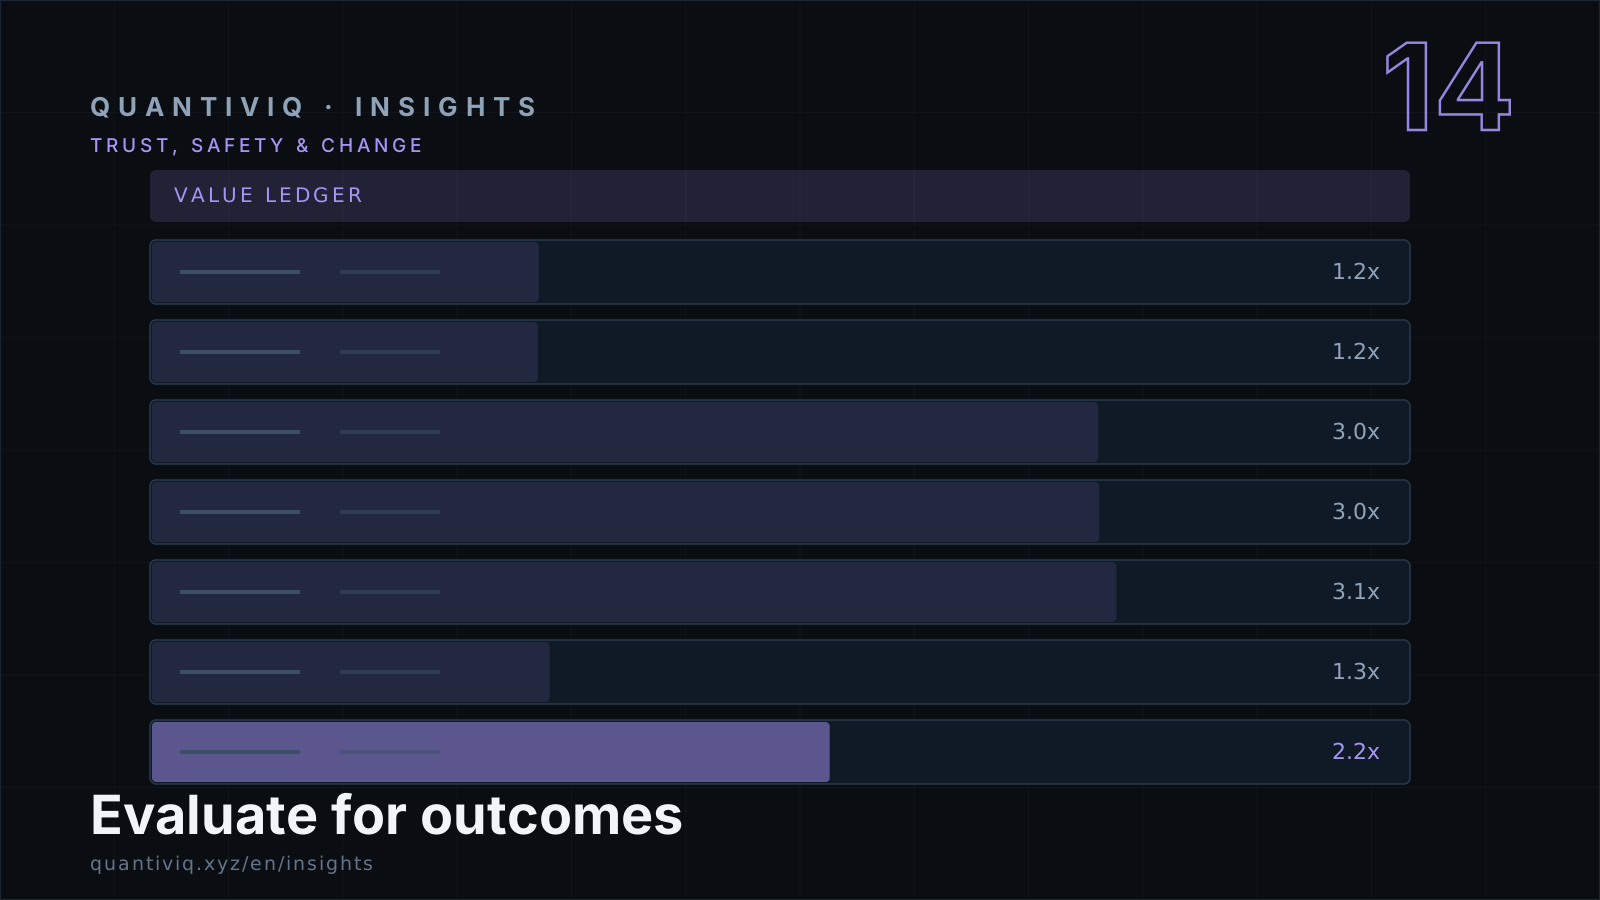
Agent evaluation for business outcomes is a three-level chain: task success measured on your own distribution of real cases, connected upward to business-metric movement, and priced as cost per successful outcome. Public benchmarks measure none of these — they measure performance on someone else's distribution, and the gap between the two is where agent programs go to die. You cannot evaluate what you cannot define, so the chain starts with a golden dataset: a curated, stratified set of your real cases with known-correct answers and a grading rubric. That dataset is the specification. Everything else — regression suites, drift monitors, promotion decisions, cost accounting — is instrumentation built on top of it.
The value case for this discipline is now quantified. BCG's 2026 research on agentic AI value — as analyzed by validant.ai — reports enterprises that exercise systematic control over agents, including evaluation and proof of value, realizing on the order of three times the value of uncontrolled deployments, and specifically flags that self-reported control maturity overstates actual control: verified evaluation and audit trails are the differentiator.[1] Evaluation is not the compliance tax on the AI program. Evaluation is the control that the multiplier pays for.
Executive Summary
- The evaluation chain has three levels — task success on your golden set, business-metric movement, cost per outcome — and each level keeps the one below it honest.[1]
- Public benchmarks measure someone else's distribution; METR's task-horizon research shows capability moves fast (~7-month doubling of 50%-success task length) and varies by domain — your evals must track your frontier, not the leaderboard's.[3]
- Golden dataset construction is stratified sampling: real cases, known edges, adversarial attempts; the rubric defines "good" before grading begins.
- Level 2 links task metrics to business metrics through volume and value arithmetic; Level 3 prices everything as cost per successful outcome — retries, escalations and rework included.[2]
- Production evaluation is continuous: drift monitors on input/output distributions, override and escalation rates, canary rollouts — the NIST AI RMF Measure function operating daily rather than annually.[4]
Why benchmarks mislead
A public benchmark answers "how does this model perform on a fixed, public distribution of tasks?" Your agent answers a different question every day: "how does this system, with this prompt, this retrieval corpus, these tools and these guardrails, perform on our incoming distribution?" The two distributions differ in every dimension that matters — vocabulary, edge-case frequency, data staleness, tool failure modes — and the system wrapping the model changes behavior as much as the model does.
Two properties of frontier capability make the gap structural rather than fixable by benchmark-watching. First, capability moves fast: METR's measurements on software task suites found the 50%-success task length doubling roughly every seven months, which means any static judgment of "what agents can do" has a shelf life measured in quarters.[3] Second, capability varies by domain — METR's own follow-up work shows horizons differ across domains — so a leaderboard result in code generation says little about your contract-analysis agent.[3] The conclusion is not that benchmarks are useless; they are excellent for tracking the frontier's general movement. The conclusion is that your eval suite is the only instrument that measures your agent on your work, and it needs the same maintenance cadence the models get.
Level 1: Task evaluation — the golden set discipline
The evaluation chain stands on a pyramid, and the pyramid's geometry is the discipline: task metrics keep business metrics honest, business metrics keep cost metrics meaningful — and production drift feeds everything back down to the golden set.
Construction. Stratified sampling of real historical cases across the task's true distribution: common cases, rare-but-important cases, known edge cases (the ones that broke the last manual process), and adversarial cases (hostile inputs, prompt-injection attempts, boundary conditions). Two hundred well-chosen cases beat two thousand scraped ones. The set is versioned, with a changelog; it grows from production sampling (Level 3's loop) so the distribution it tests keeps up with the distribution you serve.
The rubric. Define "good" before grading: pass/fail criteria for correctness, plus a graded rubric for quality dimensions (completeness, source-citation, tone, format compliance). Where humans grade, measure inter-rater agreement on a sample; a rubric two graders apply differently is not yet a rubric, it is two opinions.
Regression suites. Every proposed change — prompt, model version, retrieval tweak, tool update — runs the full suite before promotion. The threshold is stated in advance ("no regression beyond 1 point on the rubric mean, zero failures on the adversarial slice") and enforced mechanically. This converts "the change feels better" into "the change is better on the distribution we serve," which is the only sentence that matters at a review board.
Gartner's agent-reality guidance is the market-level version of the same argument: agent success hinges on reliability — the product of evaluation and error handling — rather than raw autonomy or benchmark scores.[2]
Level 2: Outcome evaluation — connecting tasks to business
Task metrics connect to business metrics through arithmetic, and the arithmetic should be written down: task success rate × task volume × value per task = the value channel. An agent handling 40,000 invoice exceptions a year at 87% task success and $9 saved per successful resolution moves $313k of annual value through that channel (illustrative arithmetic; the inputs come from your own baseline, as the measurement framework details).
Level 2's discipline is the connection: when task success improves five points, does the business metric move? The verification instruments are the ones from staged rollout — holdout groups, before/after with trend adjustment, matched comparisons — arranged on the evidence-quality ladder from directional self-report to randomized rollout. The value ledger books the result with its confidence grade; the board sees a number it can interrogate.
The anti-pattern Level 2 exists to kill is the accuracy parade: reporting eval-set scores to the board as if they were value. Accuracy is a model-quality metric (the base of the metric tree); it justifies nothing until connected through volume and value to a business line. Boards should ask for the connection every time it is missing — the request itself trains the organization.
Level 3: Cost evaluation — cost per successful outcome
The third level prices quality: cost per successful outcome, not cost per call. An agent that costs $0.04 per call, succeeds on 70% of calls, escalates 20% to humans at $4.50 per escalation, and triggers rework on 5% at $12 per rework has a true cost per successful outcome of roughly $1.75 (illustrative arithmetic: (0.04 + 0.20 × 4.50 + 0.05 × 12) / 0.70). Cut the error rate in half and the cost per success falls sharply even if unit prices never move — which is why the cost stack analysis treats evaluation as the only budget line that reduces the others.
Level 3 also disciplines model choices: a stronger model at 3x the token price that lifts task success from 82% to 95% may reduce cost per outcome by cutting escalations and rework. The arithmetic decides, per task class — which is model routing in practice, and it is impossible without Levels 1 and 3 instrumented.
Continuous evaluation in production
Production is where the golden set stays alive. Four monitors, watched weekly:
- Input distribution drift — the incoming cases change shape (new invoice formats, new customer types); the golden set lags, so drift alerts trigger sampling the new inputs into the set.
- Output distribution shift — the agent's behavior moves even with no code change (model-provider updates, retrieval staleness); shift alerts trigger investigation before customers notice.
- Override and escalation rates — humans overruling or escalating more than baseline is the cheapest early-warning signal of quality decay, and directly prices supervision load per the supervision model.
- Cost per outcome trend — the Level 3 metric over time; creep here precedes value erosion in the ledger.
Canary rollouts complete the loop: changes ship to a small traffic slice, the eval dashboard watches, promotion or rollback follows the evidence. This is the NIST AI RMF's Measure function — continuous, proportional measurement — operating as instrumentation rather than an annual audit, with the Manage function acting on what the monitors show.[4]
Roles and cadence
The evaluation engineer owns the golden sets, rubrics, regression suites and monitors — the successor discipline to QA, per the team-design analysis. Domain experts grade a weekly sample and keep the rubric honest against what "good" means in the business. The review board sees the eval scorecard monthly: task success by mission, drift flags, cost per outcome trend, promotion decisions taken and pending — the compact dashboard that makes BCG's systematic-control multiplier operational rather than aspirational.[1]
Key Takeaways
- Evaluation is the control that pays: systematic control and proof of value correlate with ~3x value from agentic AI, per BCG research as analyzed by validant.ai — and self-reported control overstates actual control.[1]
- The chain runs task → outcome → cost; each level needs its own instrument, and the board should never accept a metric from one level dressed as another.
- Golden datasets are the specification: stratified, versioned, rubric-graded, refreshed from production; the regression suite gates every change.[2]
- Cost per successful outcome — not per call — is the number that prices quality and routes models; evaluation is the only spend that reduces other spend.[3]
- Production evaluation is continuous monitoring plus canary discipline: the NIST Measure function as daily instrumentation.[4]
What Leaders Should Do Next
- Build the first golden set for the flagship agent. (Evaluation engineer + domain experts, first 30 days.) 200 stratified real cases, written rubric, inter-rater check on a sample. No new model or prompt changes ship until the regression suite runs against it.
- Write the connection arithmetic for every live agent. (Mission leads, first 30 days.) Task success × volume × value per task, with the business metric named and baselined — one page per agent, reviewed at the board.[1]
- Instrument cost per successful outcome. (Platform + finance partner, first 60 days.) Retries, escalations and rework included; trend it monthly next to the value bookings in the ledger.
- Stand up the four production monitors. (Evaluation engineers, first 60 days.) Input drift, output shift, override/escalation rates, cost trend — with weekly review and a written response playbook for each alarm type.[4]
- Institute the monthly eval scorecard at the review board. (CFO office + transformation lead, first 90 days.) Same page every month: success rates, drift flags, cost trends, promotions and stalls — so quality conversations happen on evidence, in rhythm, before the incidents.[2]
References
- Boston Consulting Group — The Formula for Agentic AI Value, Sep 30, 2026; ~3x systematic-control multiplier and self-reported-control caveat as analyzed by validant.ai. bcg.com — figures via secondary summary.
- Gartner — AI Agent Success Hinges on Reliability, Not Autonomy, 2025-2026. gartner.com — analyst guidance on reliability as the binding constraint.
- METR — Measuring AI Ability to Complete Long Tasks, arXiv:2503.14499 (2025, revised). arxiv.org — ~7-month doubling of 50%-success task length; software benchmarks; domain variation per follow-up.
- NIST — Artificial Intelligence Risk Management Framework (AI RMF 1.0), NIST AI 100-1, Jan 26, 2023. airc.nist.gov — Govern/Map/Measure/Manage; continuous, proportional measurement.
Discussion questions
Questions executive teams can use to pressure-test this analysis against their own organization.
- What is our current task-success rate on our own golden set for our flagship agent — and when did we last measure it?
- If model quality improved five points on our eval suite tomorrow, which business metric would move, by how much, and who would see it first?
- Who in our organization owns the golden datasets, and is that person's time protected for grading or consumed by firefighting?
4 sources cited · How we research and verify: Editorial methodology. Links verified 2026-10-23.